

July 4, 1976 (Ls 90) to Feb 13, 1979 (Ls 230)
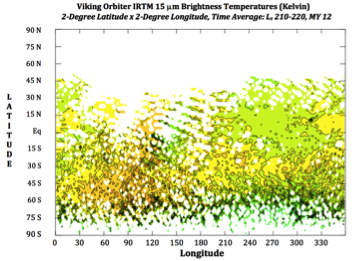
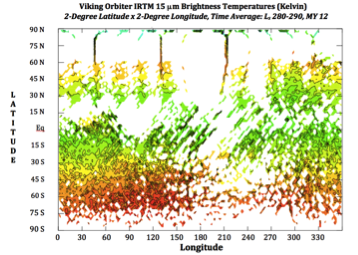
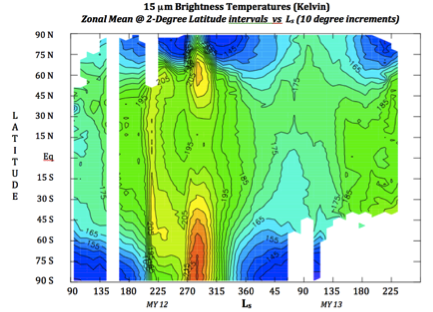
Atmospheric "T15" temperatures (15 μm brightness temperatures) were derived from Viking Orbiter IRTM measurements. The two maps on the left were averaged over 10 degrees of Ls, 210-220 and 280-290, MY 12 for 2-degree latitude by 2-degree longitude bins. A more seasonal representation of T15 in the form of zonally (longitudinally) averaged T15 over 10 degree Ls time increments for the duration of the Viking Orbiter mission, Ls 90 MY 12 through Ls 235 MY 13 is shown on the right. All available times of sol are included in these averaged temperature values, but sampling is not necessarily uniform, nor is the spatial coverage (as illustrated by the maps above).
Useful Mission Documents
Description of the DATA Document
The data contained within the Viking orbiter IRTM temperature archive provide the location (latitude, longitude), time (Ls and time-of-sol), and derived temperature and albedo values (and their standard deviations). They are in the form of averaged values spanning 10-degree Ls and 2-degree latitude by 2-degree longitude. In addition to the 15 μm atmospheric temperatures the archive also provides ground temperature (20 μm brightness temperature, T20) and differences between T20 and T7 (7 μm brightness temperature), T20-T9 (9 μm brightness temperature), and T20-T11 (11 μm brightness temperature), and two forms of derived albedo. Standard deviation values are available for each of these measurements.
Calibrated data
These data are in a tabular ASCII form in the surface.dat file located within the data folder in the archive volume vo_3002. The contents of and structure of this data file are described in the file surface.lbl.
Useful Mission Documents
Description of data volume
Mission Description
Spacecraft Description
Instrument Description
References
Mission Description
Spacecraft Description
Instrument Description
References
Description of the DATA Document
The data contained within the Viking orbiter IRTM temperature archive provide the location (latitude, longitude), time (Ls and time-of-sol), and derived temperature and albedo values (and their standard deviations). They are in the form of averaged values spanning 10-degree Ls and 2-degree latitude by 2-degree longitude. In addition to the 15 μm atmospheric temperatures the archive also provides ground temperature (20 μm brightness temperature, T20) and differences between T20 and T7 (7 μm brightness temperature), T20-T9 (9 μm brightness temperature), and T20-T11 (11 μm brightness temperature), and two forms of derived albedo. Standard deviation values are available for each of these measurements.
Calibrated data
These data are in a tabular ASCII form in the surface.dat file located within the data folder in the archive volume vo_3002. The contents of and structure of this data file are described in the file surface.lbl.